

Gentrification is the process of rejuvenating deteriorated urban neighbourhoods and it has been observed in many cities in Canada and around the world - with wide-ranging effects. This phenomenon does not just happen in socioeconomically disadvantaged regions of a city, and once it begins it can rapidly expand.
Now, a new deep-mapping computer model created by Professor Michael Sawada and students Lazar Ilic and Amaury Zarzelli of the Department of Geography, Environment & Geomatics the University of Ottawa can detect visible changes to individual properties, allowing them to track gentrification more rapidly within neighbourhoods and cities.
The visible changes accompanying gentrification in cities have been the least studied aspect of the process, mostly because of the challenges involved in acquiring photographic imagery. It would take years for someone to examine photographs of every structure using Google Street View to see if there have been property improvements.
Previous studies have sought to use census data to identify and analyze gentrification, but they are limited in space and time, and create artificial divisions at census boundaries. Sawada says that their study is the first to use the appearances of individual properties — the smallest spatial unit upon which a gentrification process can act — to detect possible gentrification.
The research team accessed Google Street View (GSV) 360-degree panoramas of every property within the urban core of Ottawa and adjacent regions for every year from 2007 to 2016. They trained a deep-mapping computer model to process this data, looking for visible improvements to the properties over time that could indicate gentrification, such as new fences, landscaping, siding and structural changes. After training, the model achieved 95% accuracy in detecting visual gentrification indicators.
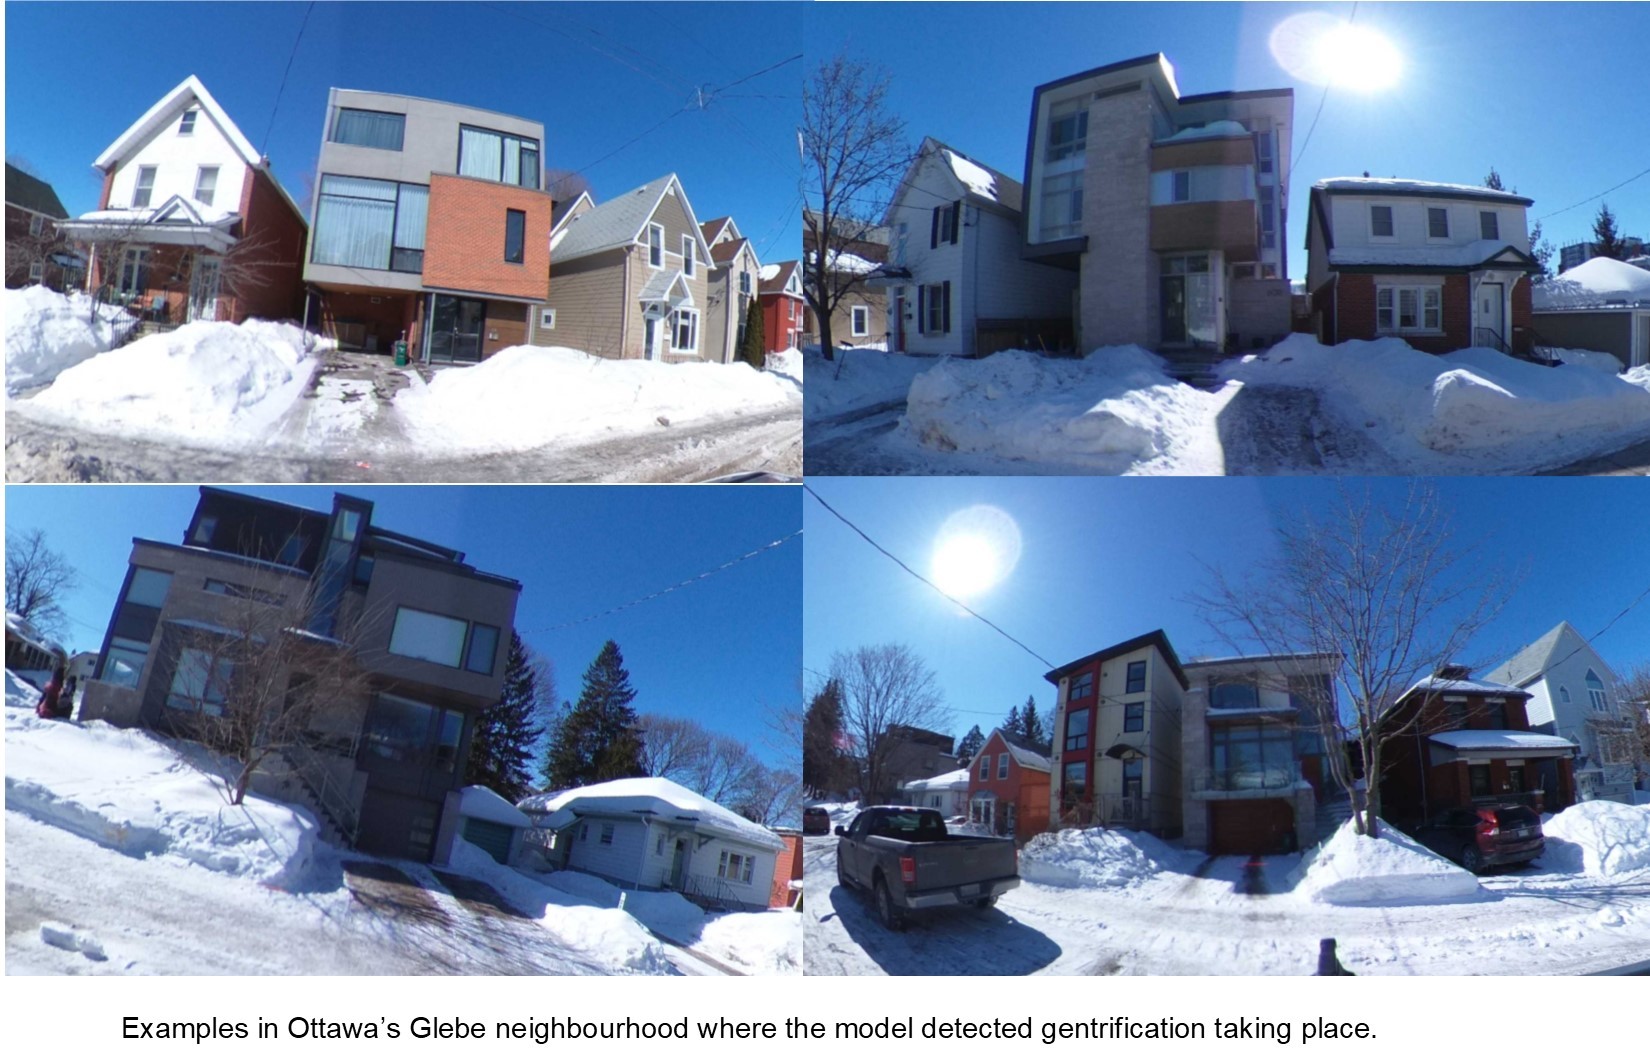
“We used a deep learning AI to scour hundreds of thousands of Google Street View images of Ottawa’s buildings to flag where and when gentrification-like visual improvements to properties took place,” explains Ilic. “And, for the first time, we were able to provide the most detailed maps of spatial evolution of gentrification through time in a major city.”
The model detected 3,483 instances of gentrification indicators at 2,922 unique locations within Ottawa’s urban core. The gentrification density map generated matched very closely a map showing where development and building permits had been granted.
The model relies on a photographic dataset being maintained and updated over time, such as the GSV maps used in the study. Changes to the ways these photographic datasets are collected can reduce the model’s accuracy. However, the researchers note that their deep-mapping model can be easily recreated in locations with similar datasets available. A relatively modest time investment can now produce highly spatially and temporally resolved maps of the gentrification process.
“It is a fact that gentrification is reshaping our cities,” explains Sawada. “Yet, until now it was hard to determine where and how fast the phenomena was occurring in large dynamic urban centers.”
These gentrification maps will have direct implications for city planning, social justice and addressing inequality in large urban centers around the world.
The study is published in the open-access journal PLOS.
Media inquiries
Karyne Vienneau
Media Relations Officer
Cell: 613-762-2908
[email protected]